Our verdict on Courtyard
Courtyard tells you more about your chances than any app we track, and then shows you a shop window that has nothing to do with them. Both halves of that sentence are unusual, and the second one is the finding this review exists for.
The disclosure is real. Every pack screen carries a Distribution panel — five value bands with a percentage against each, plus Courtyard’s own average item value. We have captured 28 of them. Triumph publishes bands and no average; Arena Club publishes per-card odds and no values at all. Courtyard is the only one of the three whose own screens contain enough to compute a break-even chance, and we compute it below from its numbers, not ours.
Everything that follows is read off Courtyard’s own screens.
One scope note before the numbers. Courtyard’s shelf carries 15 categories, and only three of them are trading-card sports we have captured. The others are Pokémon-adjacent and well beyond cards altogether: One Piece, Magic The Gathering, Graded Coins, Comics, Watches, and Sealed Booster — unopened product rather than a graded slab. So Courtyard is a graded-asset marketplace that happens to sell card packs, not a card-rip app that happens to sell other things. Everything priced below covers baseball, basketball and Pokémon: 28 published distributions and 24 pack screens. Treat those as a floor on what Courtyard offers, not a total.
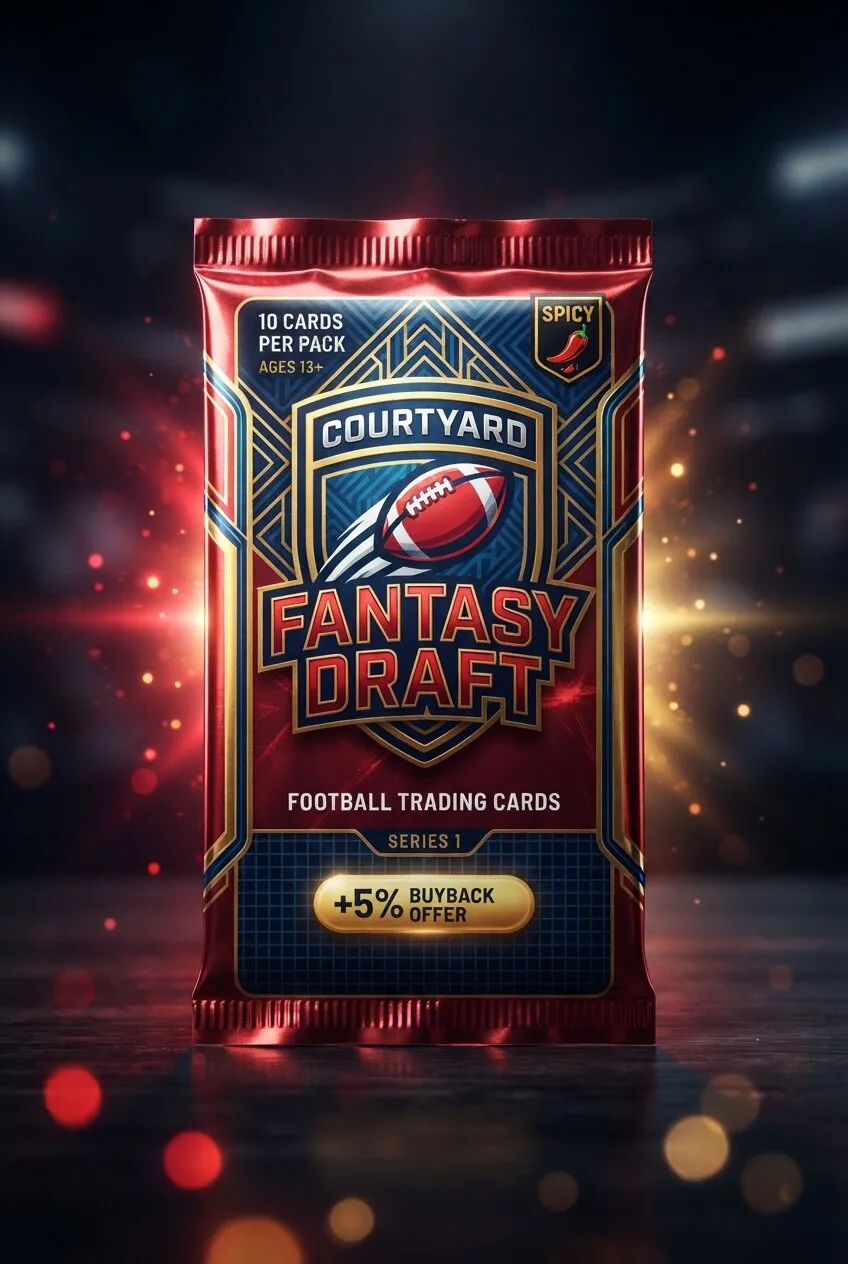
Football is a fourth card sport, and we have just started on it. Courtyard runs nine football packs — Basic through Mythic, the same ladder as the other sports — and we now hold the Heavy Hitters window for all nine: 180 slabs, 178 of them with a grade on the label, led by a 2000 Bowman Chrome Tom Brady in PSA 10. What we do not yet have is a single football price, odds table or value, so there are no football pack pages here and no football figure in any table. Naming the cards without pricing the packs would be the mistake we criticise Arena Club for.
What the odds actually say
Across the 27 packs where the price sits exactly on a band boundary, the published chance of finishing at or above what you paid runs from 17% to 28.9%. Inverted: Courtyard’s own odds give you a 71–83% chance of finishing below the purchase price.
The design is strikingly rigid. On 20 of 28 packs the worst possible pull is exactly 70% of the price, and the stated average item value is 95% on every pack under $2,500 and 96% at $2,500 and above. Two values, 28 packs, three sports, a 200× price range. That is a parameter someone chose, not a distribution someone measured — and it holds whether you are spending $25 or $5,000.
The panel is live, and we have now measured it rather than caught it once. We re-captured ten packs a day apart: nine of the ten changed at least one published percentage, and only Basketball Master was byte-identical.
But look at what moved. Of 21 individual percentage changes, 14 were inside the below-price bands — the region where every outcome is a loss anyway. The number a buyer would actually act on hardly budged: break-even was unchanged on six of the ten, and the largest move anywhere was 2.2 points.
| Pack | Break-even, day 1 → day 2 | What changed |
|---|---|---|
| Pokémon Legend (Spicy) | 22.7% → 20.6% | Largest drift seen: band 1 fell 44%→35%, band 2 rose 33%→44% |
| Baseball Master | 20.1% → 21.1% | One point crossed the price line |
| Pokémon Legend | 17.0% → 16.0% | 28→26, 55→58, 16→15 |
| Baseball Diamond | 19.1% → 19.0% | Five bands became four — see below |
| Baseball Platinum | 21.1% → 21.1% | 60→61, 19→18, both below price |
| Basketball Diamond | 20.2% → 20.2% | 61→60, 19→20, both below price |
| Basketball Legend | 20.1% → 20.1% | 59→58, 21→22, both below price |
| Baseball Legend | 22.1% → 22.1% | 55→57, 23→21, both below price |
| Pokémon Platinum (Spicy) | 25.5% → 25.5% | Percentages identical; the floor moved $251 → $255.50 |
| Basketball Master | 21.2% → 21.2% | Nothing |
This cuts both ways, and both ways are worth saying. For Courtyard: the real-time claim is true, and it is plainly not being used to walk the headline number around while nobody watches. Against Courtyard: it is the sharpest evidence yet that the ~95% average and the ~20% break-even are parameters rather than measurements. The live recalculation moves everything except them.
One pack changed structurally rather than numerically. On the re-capture, Baseball Diamond showed four bands instead of five: the $2,000–$4,000 at 2% and $4,000–$16,000 at 0.1% appeared merged into a single $2,000–$16,000 at 2%, with the panel summing to exactly 100% and the ceiling unchanged.
Two caveats we would rather state than bury. That merge was seen on the re-capture only, and the five-band panel is what this pack’s own page still publishes, because that is the capture we transcribed in full — so if the two disagree, the pack page is the older of the two readings, not a contradiction of it. And an earlier version of this paragraph attached 48 showcased slabs to Baseball Diamond. That was wrong: the 48-slab window belongs to Baseball Platinum, and Baseball Diamond has no showcase window in our data at all. We have withdrawn the claim rather than restate it against the right pack, because the band it would land in is Platinum’s 0.1%, not the 2% the sentence was built to illustrate.
How fast does the window actually turn over?
Heavy Hitters is live, so the obvious worry is that it churns — that the window you price today is gone tomorrow, and nothing measured against it means anything. We can now test that, because we hold two captures of the same window a week apart: 579 slabs with values on 8 September, and 1,248 slab images on 15 September.
One methodological point first, because it changes the answer. The second capture went deeper on some packs and shallower on others — about 48 slabs per pack for baseball and Pokémon, but only 20 for basketball. Where the second capture is shallower than the first, a low survival rate says nothing about the window; it just says we looked at less of it. So the measurement runs only on the 13 packs where the second capture is at least as deep as the first:
| Pack | Then | Now | Still there |
|---|---|---|---|
| Baseball Pro | 36 | 48 | 97% |
| Baseball Starter | 36 | 48 | 94% |
| Pokémon Legend | 34 | 47 | 94% |
| Baseball Master | 29 | 46 | 93% |
| Pokémon Diamond (Spicy) | 35 | 47 | 91% |
| Pokémon Diamond | 36 | 47 | 89% |
| Pokémon Platinum (Spicy) | 36 | 46 | 86% |
| Pokémon Platinum | 34 | 47 | 82% |
| Pokémon Ultra | 36 | 48 | 67% |
| Pokémon Pro | 32 | 44 | 56% |
| Pokémon Ultra (Spicy) | 34 | 48 | 44% |
| Pokémon Starter | 33 | 48 | 36% |
| Pokémon Master | 35 | 47 | 31% |
Median survival is 86%. The window is live but it is not a carousel: on most packs, the large majority of what you saw a week ago is still sitting there. That matters for everything else on this page — a ceiling proved against the 8 September window is not measuring a set that has since evaporated.
The exceptions are worth naming rather than averaging away. Pokémon Master, Starter and Ultra (Spicy) turned over 56–69% in seven days, against Baseball Pro’s 3%. Whatever drives the rotation, it is not uniform across the shelf.
Two caveats. The match key is year plus card number, because the second capture’s Pokémon filenames mostly carry no grade — that is coarser than the identity used elsewhere on this page, and it can only overstate survival. And the ten packs excluded above are excluded for a reason: basketball’s second capture reached 20 slabs against a 31–43 slab first capture, so its apparent 30–50% survival is a floor set by our own sampling, not a property of Courtyard’s.
Where the valuations come from
Courtyard is the only app we track that names its comp sources. The fine print under every Distribution panel reads: “Comps are informed by recent sales and data from platforms such as eBay, PWCC, and Sportscardspro.”
That matters more than it looks. Every one of these apps values your card with its own algorithm, and that algorithm decides what a buy-back is worth — but the others treat the inputs as a black box. Naming eBay, PWCC and Sportscardspro is a checkable claim, and it means anyone grading Courtyard’s valuations can use the same three sources it does rather than arguing about methodology.
Courtyard goes further than naming the sources: its card pages show the Market Value, a Confidence flag, and its own recent sales for the same card and grade, all on one screen. That is enough to check the valuation against the evidence beside it, which we have now done on nine cards — see how good is the valuation.
The headline is a number Courtyard does not publish. Across 24 cards we captured 11 standing offers, and four of them are exactly 84.6% of Courtyard’s own stated Market Value — to the cent:
| Card | Market Value | × 0.846 | Actual top offer |
|---|---|---|---|
| Gardevoir & Sylveon GX | $5,057.60 | $4,278.73 | $4,278.73 |
| Bugsy’s Scizor (listed) | $4,026.90 | $3,406.76 | $3,406.76 |
| Yamamoto Sapphire auto | $5,922.00 | $5,010.01 | $5,010.01 |
| Trae Young Purple Pulsar | $1,929.70 | $1,632.53 | $1,632.53 |
Different owners, one listed for sale and three not, values spanning $1,930 to $5,922. That is a formula, not a market — and the other seven offers all sit above it, which is what real bids competing over an automated floor look like. Courtyard never publishes its buy-back percentage; a standing bid fixed at 84.6% of its own valuation is the closest thing to one we have found. We cannot prove the bidder is Courtyard rather than a third-party market maker, but nobody types $5,922 × 0.846 by hand. Measured against real market rather than Courtyard’s own value, that bid pays 81.3%–86.4%, a mean of 84.8% — so selling back costs you about 15% for instant liquidity.
And the valuation behind it is good. We checked ten of Courtyard’s stated values against independent sold comps — matching grade and parallel, which turns out to be essential. On the four resolvable with sold-derived data the median error is 3.1 points: 101.9%, 97.7%, 96.2%, 89.4% of true market.
That reverses two things we published. Our earlier criticisms measured Courtyard’s value against the recent sales Courtyard itself displays, because that was all we had — and those displayed comps are the least reliable thing on the screen. The Confidence flag also works: the five cards flagged High average 4.6 points of error against the market, against 25 points for the two flagged anything else.
The clearest case is the card we were rudest about. Courtyard’s page for the 1954 Topps #128 Hank Aaron PSA 3.5 shows no sales at its own grade, PSA 10 rows in their place, and a $5.00 sale beside a $295,850.00 one — flagged High. Its valuation is 97.7% of the real last sold price. The number was fine; the evidence displayed beside it is garbage. That is a UI defect, not a pricing one, and it invites exactly the wrong conclusion — we drew it twice.
Full workings, including the two cards we could not resolve, at is the valuation any good.
One valuation detail worth keeping: two separate slabs of the same card at the same grade carry the identical Market Value, so the valuation keys on card-and-grade as you would hope. Their top offers differ — the lower of the two is exactly 84.6%, the higher is a real bid.
Heavy Hitters is not your pack
Every pack screen carries a Heavy Hitters gallery of graded slabs with prices — Mantles, a hand-cut Babe Ruth, a 1st Edition Charizard. It reads as a preview of what is inside this pack. It is not.
It is one vault-wide leaderboard per sport, shown on every pack screen in that sport, cut off at that pack’s own stated maximum pull. We hold 24 pack screens across baseball, basketball and Pokémon, carrying 579 transcribed slabs. Not one shows a slab above its pack’s stated ceiling, and every showcase tops out at 74.8%–100% of it. The proofs:
- One cent decides one card. The baseball Starter screen’s stated max is $399.99 and Pro’s is $400.00. The two show the same cards in the same order — except Pro includes the one slab priced at exactly $400.00 and Starter does not.
- A four-level nested chain. Basketball Mythic ($80,000 ceiling) contains Legend ($40,000) contains Diamond ($16,000) contains Platinum ($8,000). Mythic’s list from position 4 matches Legend’s from position 1 for 31 consecutive positions to the cent; Legend’s from position 17 matches Diamond’s for 32; Diamond’s from position 25 matches Platinum’s for 12. Every cut lands exactly on the lower pack’s stated maximum.
- Two ceilings, one window. Pokémon Ultra (Spicy) caps at $7,900 and Pokémon Platinum at $8,000. Their showcases are byte-identical across all 36 positions, because no slab in the vault happens to sit between those two numbers. It happens again at $15,900 and $16,000.
- It is the stated maximum, not a multiple of price. Across the 24 screens the ceiling runs at 8×, 11.7×, 12×, 16×, 31.7× and 31.9× the pack price. The showcase follows the published number every time, whichever multiple that happens to be.
So the gallery cannot represent a likely outcome for any pack, by construction. Here is what it shows against what the same screen says will probably happen:
| Pack | Price | Its most likely outcome | Cheapest card in the window |
|---|---|---|---|
| Pokémon Starter | $25 | $17–$21 at 47% | $364.70 — 14.6× the price |
| Baseball Starter | $25 | $17.50–$21 at 42% | $340.70 — 13.6× |
| Pokémon Pro | $50 | $35–$45 at 61% | $713.30 — 14.3× |
| Basketball Pro | $50 | $35–$45 at 63% | $686 — 13.7× |
| Basketball Master | $100 | $70–$85 at 56% | $1,216 — 12.2× |
| Basketball Ultra | $250 | $176–$215 at 60% | $2,700 — 10.8× |
| Pokémon Platinum | $500 | $351.60–$425 at 53% | $2,651 — 5.3× |
| Baseball Diamond | $1,000 | $703–$850 at 51% | $3,526 — 3.5× |
| Basketball Legend | $2,500 | $1,700–$2,100 at 59% | $6,982 — 2.8× |
| Basketball Mythic | $5,000 | $3,500–$4,200 at 57% | $9,647 — 1.9× |
On 21 of the 24 screens, every single showcased card sits in the pack’s rarest band — the one carrying 0.1% to 1%. All three exceptions are basketball, and all three sit at the top of the ladder, where the showcase gets more honest as the pack gets dearer — Legend (30 of 48 in the rarest band), Mythic (13 of 34) and SLAM (25 of 36): basketball Mythic at $5,000 is the only pack in the whole catalogue with a showcased card in a band covering 18% of pulls, and its cheapest is 1.9× the price. At the other end, Pokémon Starter’s cheapest showcased card is 14.6× the price.
SLAM is also a structural exception, not just a band one — it is the $120 basketball pack that holds a CGC-graded magazine rather than a card. Its showcase is 36 magazines and no cards at all — so the leaderboard is drawn from the pool the pack actually draws from, then cut at the ceiling. It is also the second-fairest window on the platform, at 2.6×.
We have catalogued 579 of these slabs with grades, prices and certificate numbers — read off the grid screens, which show 36 to 48 of a list that runs to about 50 per pack, so every window here is a partial read of a longer one. Because grade drives the price and the vault holds many copies, one card can span the whole ladder. A 1999 Pokémon Game #4 Charizard-Holo appears six times over:
| Variant and grade | Value | Which shop window it appears in |
|---|---|---|
| 1st Edition, PSA 8 | $35,927.00 | Legend only |
| 1st Edition, PSA 7 | $23,360.30 | Legend, Diamond (Spicy) |
| Shadowless, PSA 5 | $1,692.60 | Ultra and up |
| Shadowless, PSA 3 | $1,156.70 | Master and up |
| Shadowless, PSA 1 | $951.10 | Master and up |
| Base, PSA 7 | $747.40 | Pro and up |
Same card, a 48× spread, one grade separating $35,927 from $23,360.
None of this is hidden or false, and Courtyard never claims these cards are in your pack. But a gallery of $700 slabs on a $25 pack, sitting directly beneath a panel saying you will most likely get $17 to $21, is doing work the panel is not.
One footnote in Courtyard’s favour: a slab priced at $1,288 appears on the Pokémon Master screen and is missing from the Pokémon Ultra screen captured shortly after, even though Ultra’s ceiling is higher. Exactly one card, exactly the signature of a sale between captures — more evidence the panel is genuinely live.
Spicy packs, and what they really sell
Pokémon has five Spicy variants alongside the standard ladder, and they are the most honest disclosure on the platform. A standard pack floors at 70% of price with a 16× ceiling. A Spicy pack floors near 50% with a ceiling around 32× — at the identical 95% stated average. Half the floor for double the ceiling: a variance dial, published as one.
The showcase makes the trade concrete in a way the bands alone do not. A Spicy pack shows you the shop window of the standard pack one tier up, at roughly half the price — and it is not an approximation:
| Spicy pack | Standard equivalent | Shop window | Chance of landing in it |
|---|---|---|---|
| Ultra (Spicy), $249 | Platinum, $500 | $2,651–$7,777.40 — identical | 0.9% vs 0.1% |
| Platinum (Spicy), $499 | Diamond, $1,000 | $5,586.40–$15,264 — identical | 0.5% vs 0.1% |
| Diamond (Spicy), $999 | Legend, $2,500 | $6,309.40–$23,860 vs $7,025–$37,603.40 | 0.8% vs 1% |
So the Spicy version of a pack is not only half the price of the standard pack showing the same cards — it is five to nine times more likely to actually deliver one of them. Courtyard’s copy says the packs are “rebuilt with spicier odds and bigger chase potential.” Both halves check out, and they check out only because Courtyard publishes enough to check.
The trade is real, not free: you give up the floor. A standard $500 pack cannot return less than $350; the Spicy $499 can return $251.
Two other packs break the 16× pattern: Baseball Pro caps at 8× rather than 16×, and SLAM is not a trading-card pack at all — each one holds a CGC-graded SLAM magazine.
Fees, buy-back and what is still missing
0% seller fees on the marketplace, printed on every pack screen we captured. That is the lowest in the category, and it is what makes Arena Club’s “market’s lowest seller commissions” claim — at 10% — false.
The buy-back is where disclosure stops. Every pack screen offers to “sell it back to us instantly”, and the percentage is never published. Nor is whether an offer settles in cash or platform credit. Triumph publishes a buy-back we have measured against sold comps and confirmed pays cash; Arena Club sells a contractual 80% floor for a 10% premium. Courtyard, which publishes the most about the pull, publishes the least about the exit — and the exit is where a 71–83% chance of being underwater actually gets resolved.
Deposit and withdrawal terms are also still undisclosed. We will update this as they are confirmed.
Corrections. Earlier versions of this review said Courtyard “has not published a full set of per-tier pull odds or top-pull ceilings”, cited a $2 entry price, and described a +5% buyback promo. The first is the opposite of the truth. The cheapest pack we found is a $15 Basketball Basic, which was out of stock with no Distribution panel; the cheapest buyable pack in any of the three ladders is $25, and we found no evidence of the +5% promo in any capture, so both claims are withdrawn rather than restated.
Who Courtyard is best for
- Anyone who wants to do the maths before buying. Courtyard is the only app in this category that gives you enough to do it, and our Triumph by the numbers page shows what that looks like when an app publishes enough to check.
- Sellers, for the 0% fee — genuinely the best in the category.
- Collectors who want a specific variance profile. The Spicy packs are the best-disclosed variance trade in the category, and the only one we can price both sides of.
It is the wrong app if you need to know what your card is worth on the way out. For that, Triumph publishes a measurable buy-back and Arena Club sells a contractual floor. Our comparison hub puts all three side by side.
On the score: the 8.5 predates this research and we have left it alone. It moved in both directions — far better disclosure than we credited, and a showcase that works against that disclosure — and it deserves a proper re-scoring against how we rate rather than a nudge.
Pros
- Publishes a full value distribution for every pack — 28 of them, with its own stated average value
- The odds panel really is computed live — 9 of 10 packs re-captured a day later had moved, though the break-even barely did
- 0% seller fees on the marketplace, against Arena Club's 10%
- Real slabs from PSA, BGS, SGC and CGC — it does not grade its own inventory
- The only app we track that names its valuation sources: eBay, PWCC and Sportscardspro
- Its valuations check out: a 3.1-point median error against independent sold comps
- Spicy variants are an honest trade, published as such: half the floor for double the ceiling, and 5-9x likelier to reach the showcase
Cons
- The Heavy Hitters showcase is one vault-wide leaderboard, not this pack's contents — on 21 of the 24 screens we hold, not a single card in it sits in the bands covering 97% of pulls
- Its own odds give you a 71–83% chance of finishing below what you paid
- The stated average value is 95% of price on 26 of 28 packs, which reads as a design parameter rather than a measurement
- Some card pages show a price history for the wrong grade, with absurd outliers, under a High confidence flag — a display defect, not a pricing one
- The buy-back percentage is never published — though four standing offers we captured are exactly 84.6% of its own stated value, to the cent
- Deposit and withdrawal terms are still not disclosed